Resilience Intelligence Dashboard
A resilience signal interpretation environment designed to distinguish operationally meaningful changes from ambient information noise across regulatory, cloud, engineering, cyber, and operational sources.
The dashboard began as an exploration into a simple question:
Why does resilience intelligence often create more noise than understanding?
Most organisations today are exposed to a constant stream of resilience-related information:
regulatory publications,
vendor advisories,
engineering updates,
cloud incidents,
threat intelligence,
outage notifications,
and operational change announcements.
The challenge is rarely access to information.
The challenge is determining:
what deserves attention,
what materially changes operational conditions,
and what may alter dependency exposure or recoverability assumptions.
The Problem
Most resilience monitoring environments optimise for collection and visibility.
As a result:
low-signal updates receive the same attention as operationally meaningful changes,
important dependency condition changes become buried within administrative noise,
and operational teams become overloaded with information that rarely changes decision-making.
This creates a subtle but important problem:
The organisation may appear informed, while operational visibility quietly deteriorates beneath the surface.
What the Dashboard Explores
The dashboard is designed around a different premise:
Resilience intelligence should focus less on publication awareness and more on operational condition awareness.
Instead of simply aggregating feeds, the dashboard attempts to interpret:
what operating condition may now be different,
whether dependency exposure may have changed,
whether recoverability assumptions may need revisiting,
and whether the publication represents operational signal or informational noise.
The emphasis is therefore on:
interpretation rather than aggregation,
signal extraction rather than summarisation,
and operational relevance rather than publication volume.
Under the Hood
Several design principles shape the interpretation logic behind the dashboard.
Source-Aware Interpretation
Different publication types require different interpretation lenses.
For example:
a regulator publication,
an AWS service advisory,
a vendor release note,
and an engineering outage retrospective
should not be interpreted using the same logic model.
The dashboard therefore applies source-aware interpretation approaches depending on the publication context.
Signal Extraction Rather Than Topic Detection
The objective is not simply to classify articles into categories.
Instead, the dashboard attempts to identify operationally meaningful signals such as:
dependency condition changes,
recoverability impacts,
concentration indicators,
governance shifts,
recovery constraint signals,
and exposure-related changes.
The emphasis is on identifying:
what may now behave differently operationally.
Noise Suppression
A significant portion of resilience-related publications contain little operational value.
Examples include:
generic vendor marketing,
awards announcements,
administrative updates,
low-impact release notifications,
and non-operational commentary.
The dashboard intentionally suppresses low-signal content where possible in order to improve visibility of operationally meaningful change.
Condition-Centric Interpretation
The dashboard increasingly focuses on operational conditions rather than discrete events.
Examples include:
degraded recoverability conditions,
increased dependency concentration,
emerging coordination complexity,
reduced operational margin,
and shifts in service assumptions.
This aligns to a broader operational resilience principle:
Severity is often an outcome of changing conditions and interaction effects — not simply the result of a predefined event.
Current Direction
The dashboard continues to evolve as an exploratory environment focused on:
operational signal interpretation,
resilience visibility,
dependency condition awareness,
and resilience learning.
The objective is not to create a predictive resilience platform or automated assurance engine.
The objective is to explore whether operationally meaningful resilience signals can be surfaced earlier, interpreted more clearly, and understood in a way that improves organisational awareness under changing conditions.
Screenshot 1 — Dashboard Overview
Dashboard Overview
The dashboard aggregates and interprets operationally relevant resilience signals across regulatory, cloud, cyber, engineering, and operational sources.
Rather than treating all publications equally, the environment attempts to surface:
operationally meaningful changes,
dependency condition signals,
recoverability impacts,
and exposure-relevant developments.
The emphasis is not simply on information collection, but on improving visibility into which changes may materially alter operational conditions or resilience assumptions.
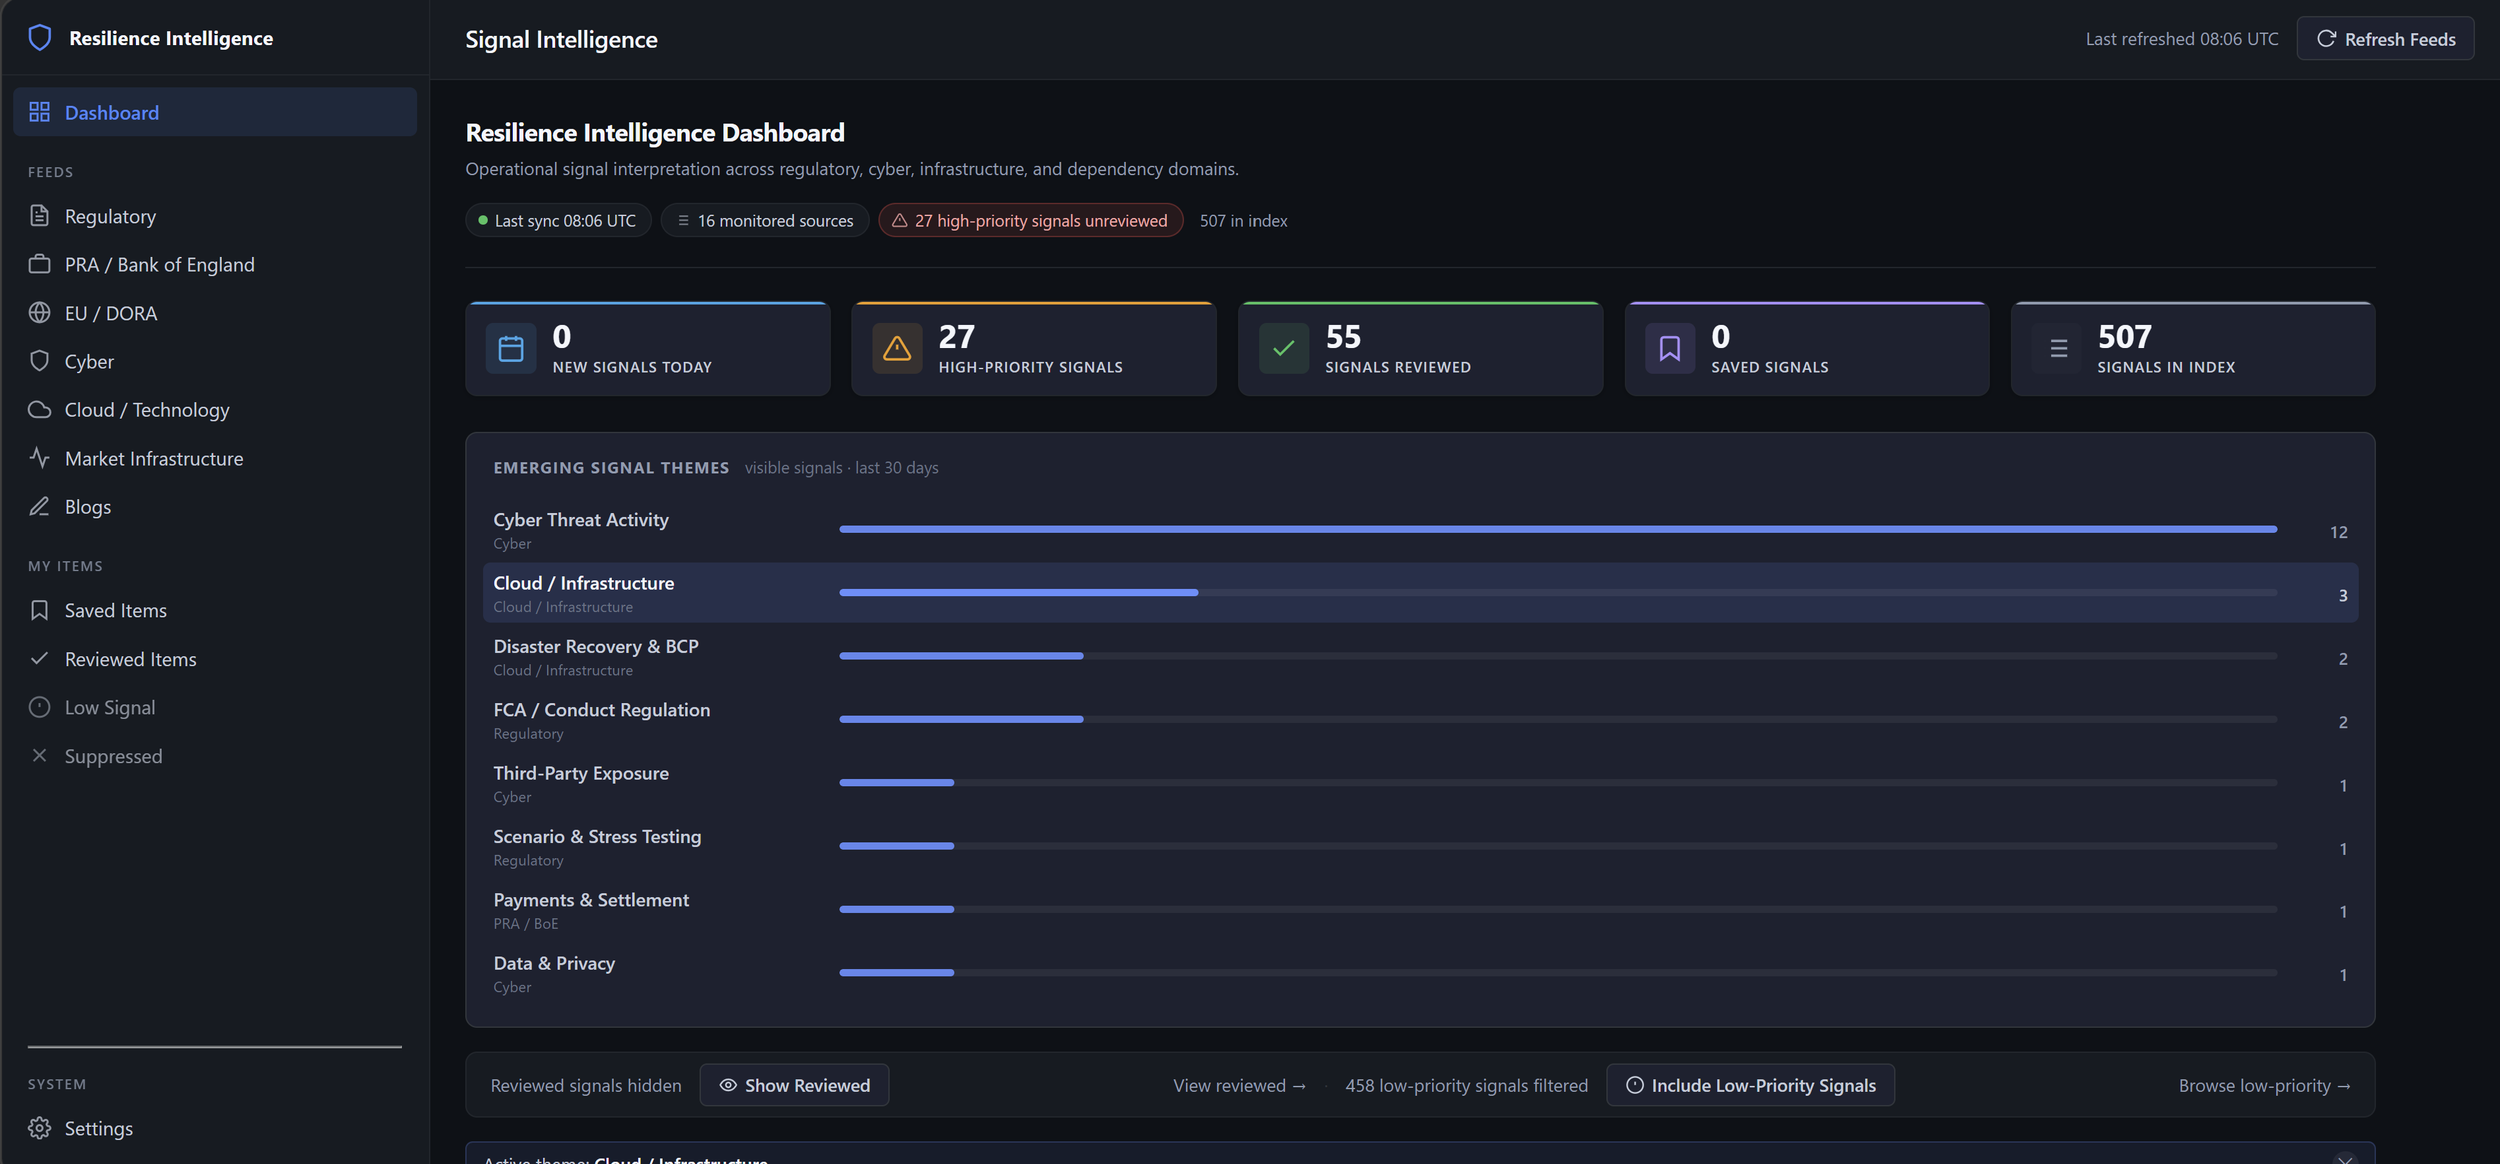
Dashboard overview showing interpreted operational resilience signals across regulatory, cloud, cyber, and dependency-related sources, with emerging themes and prioritised signal filtering.
Screenshot 2 — Signal Review & Prioritisation
The dashboard supports structured review of operationally relevant signals across multiple resilience domains.
Signals are prioritised based on potential operational relevance rather than publication volume alone, including:
dependency exposure,
recoverability implications,
concentration signals,
operational disruption indicators,
and resilience condition changes.
The review workflow intentionally supports:
interpretation,
suppression of low-value noise,
operational triage,
and structured visibility management.
The objective is not simply to ingest more information, but to improve clarity around which developments may materially alter operational conditions or resilience assumptions.
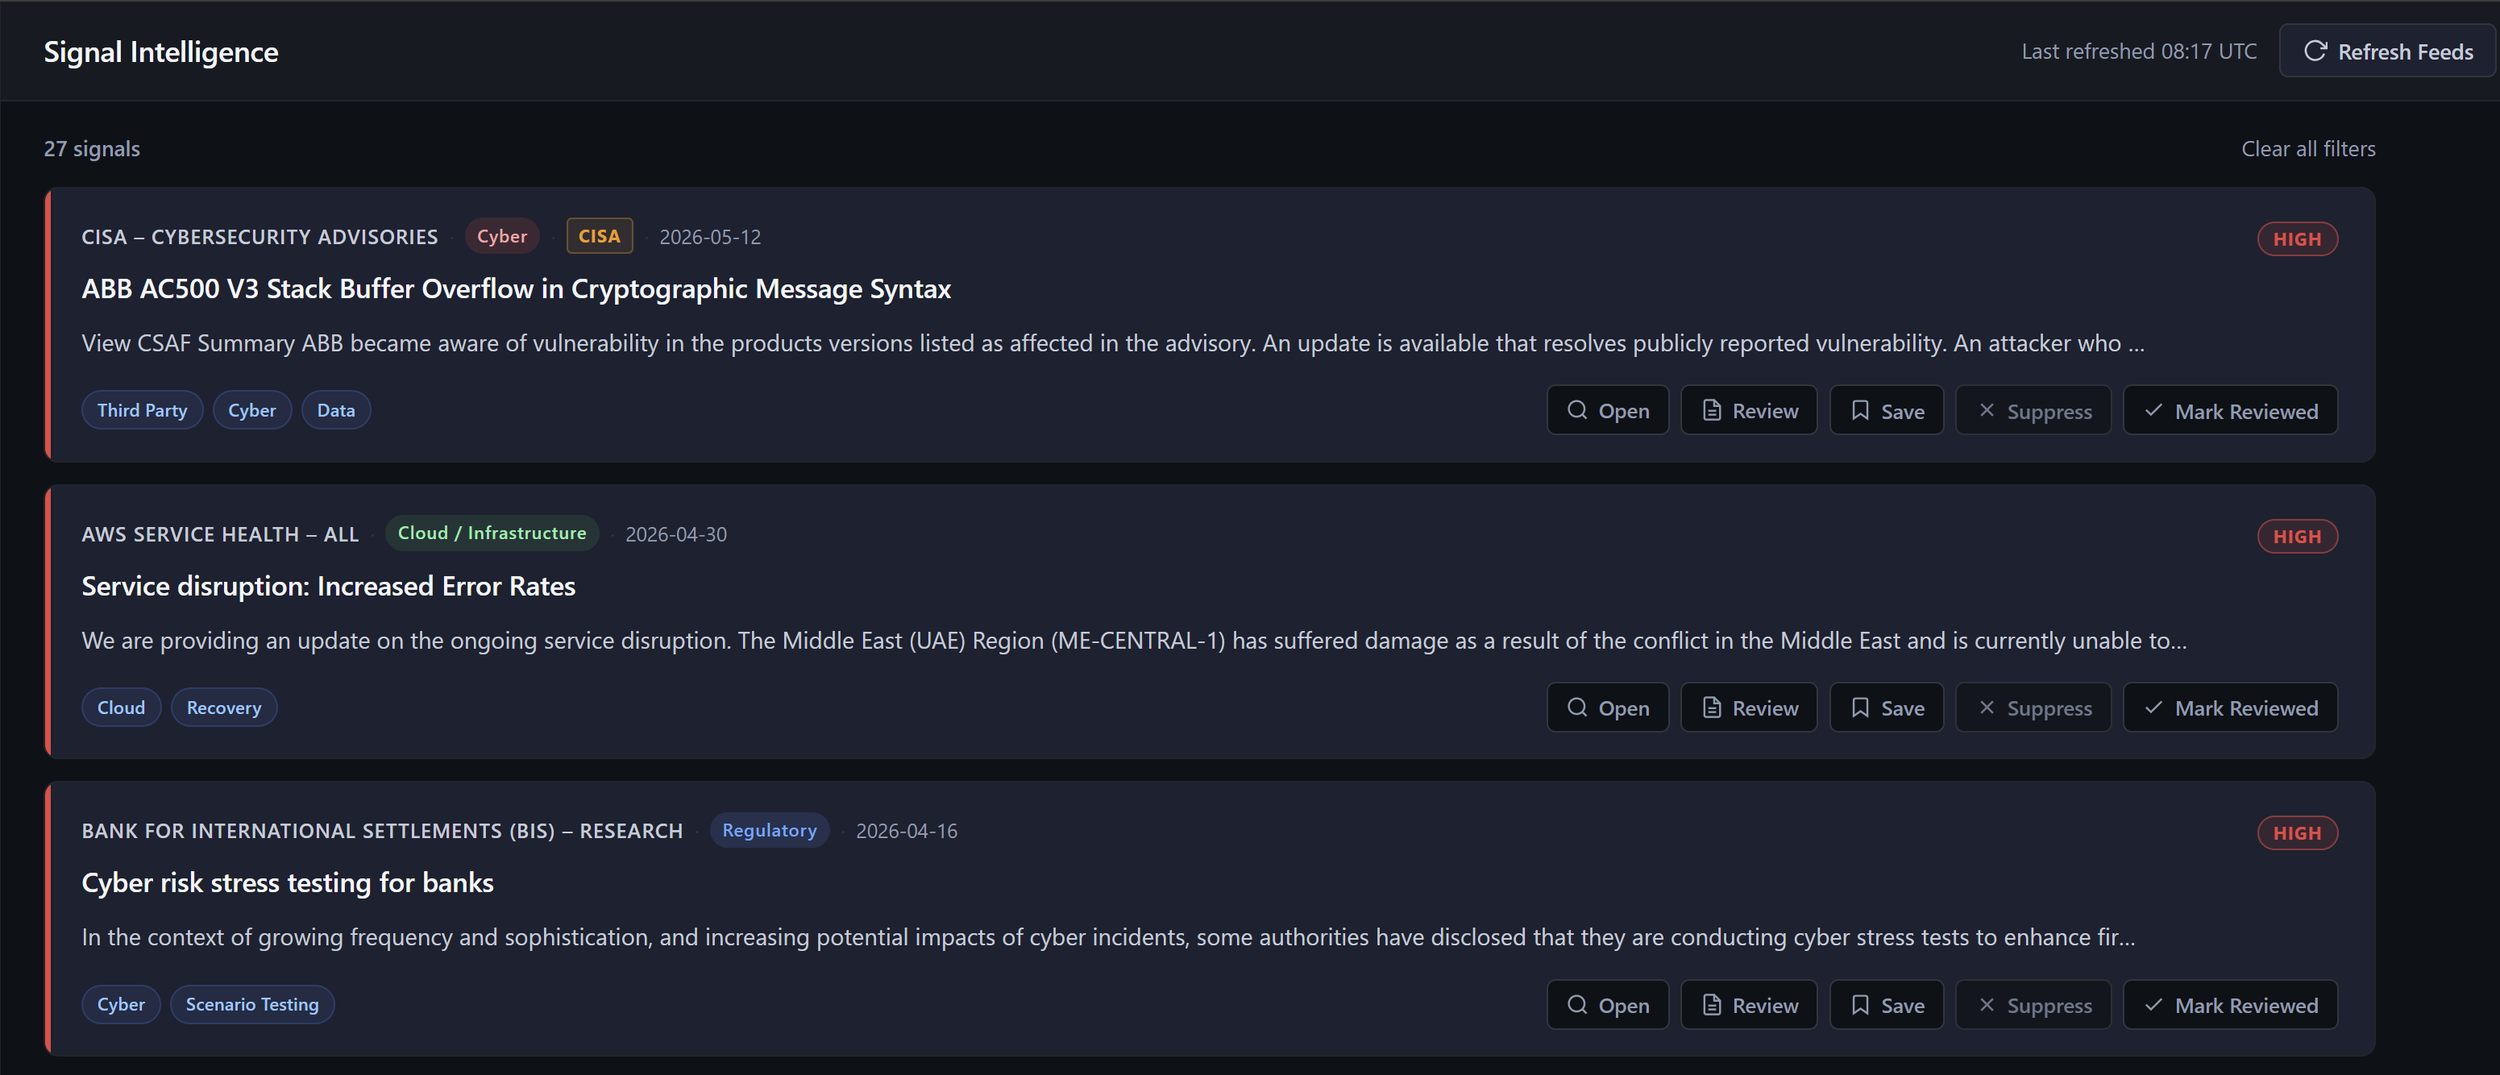
Signal review and prioritisation workflow showing high-priority operational resilience publications across cyber, cloud, and regulatory domains, including review, suppression, and visibility management actions.
Screenshot 3 — Operational Interpretation & Condition Analysis
The dashboard attempts to move beyond publication summarisation by interpreting potential operational relevance, condition changes, and resilience implications.
Rather than treating regulatory publications as static updates, the environment attempts to identify:
what operating conditions may now be different,
which assumptions may require revisiting,
where dependency exposure may have changed,
and how supervisory expectations may materially alter operational processes or recoverability requirements.
The emphasis is therefore placed on:
interpretation over ingestion,
operational meaning over publication volume,
and resilience implications over document awareness.
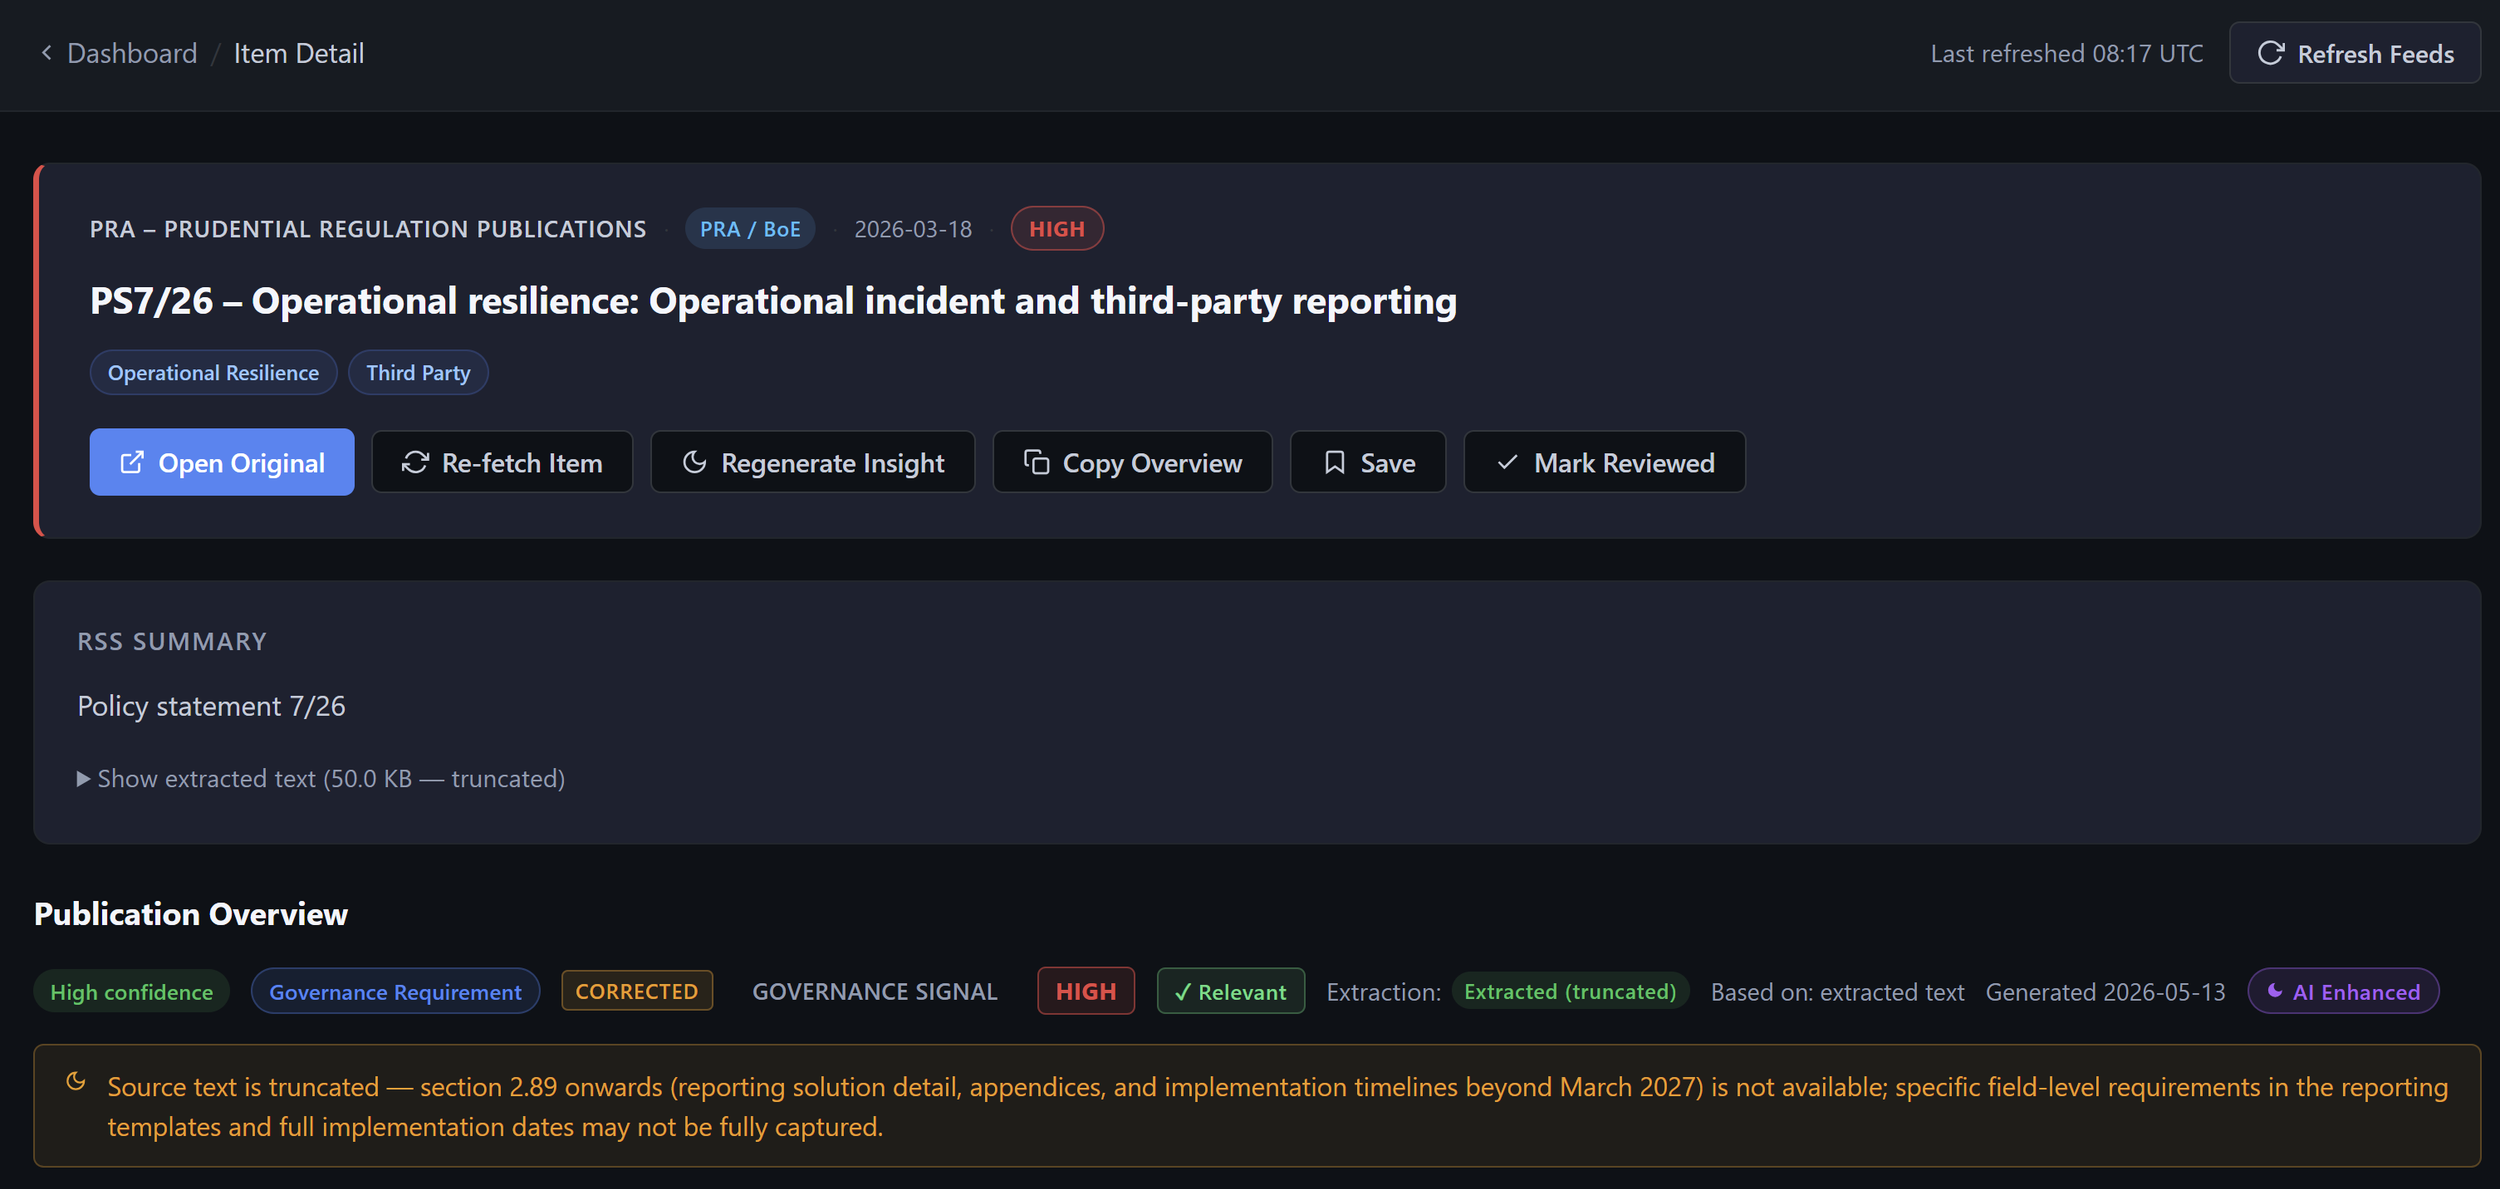
Operational interpretation view showing regulatory publication analysis, extracted resilience themes, governance signals, and contextual operational relevance layered onto supervisory and third-party risk publications.
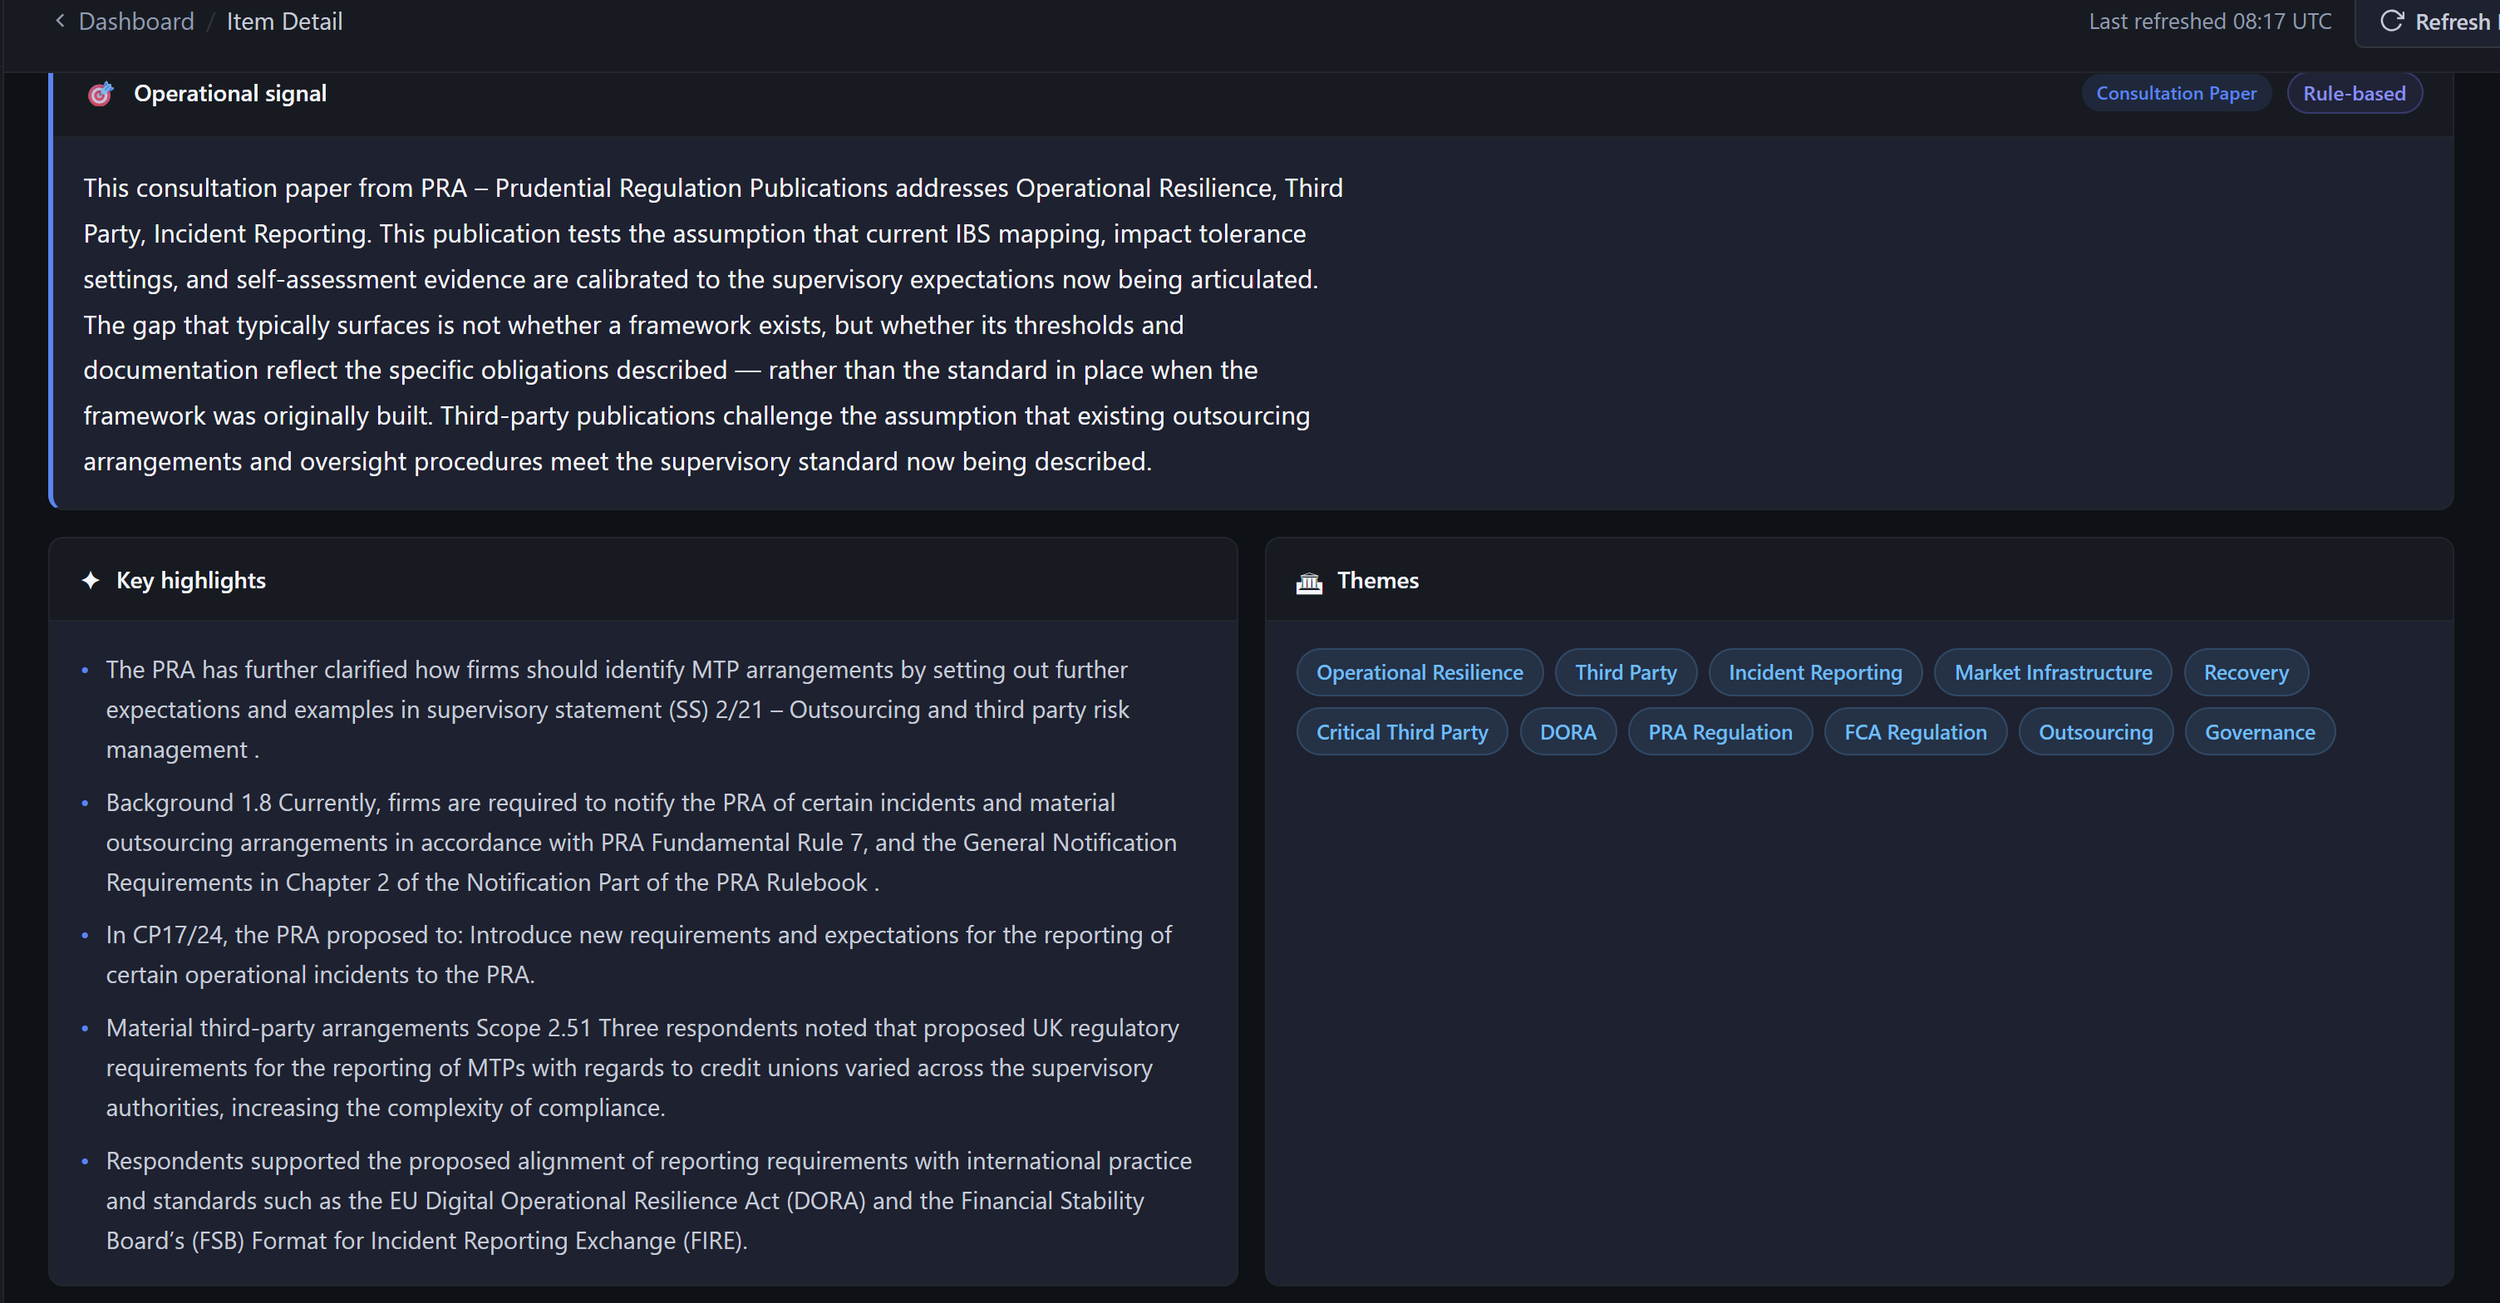
Operational signal interpretation showing extracted resilience themes, regulatory context, and structured relevance analysis applied to operational resilience and third-party risk publications.
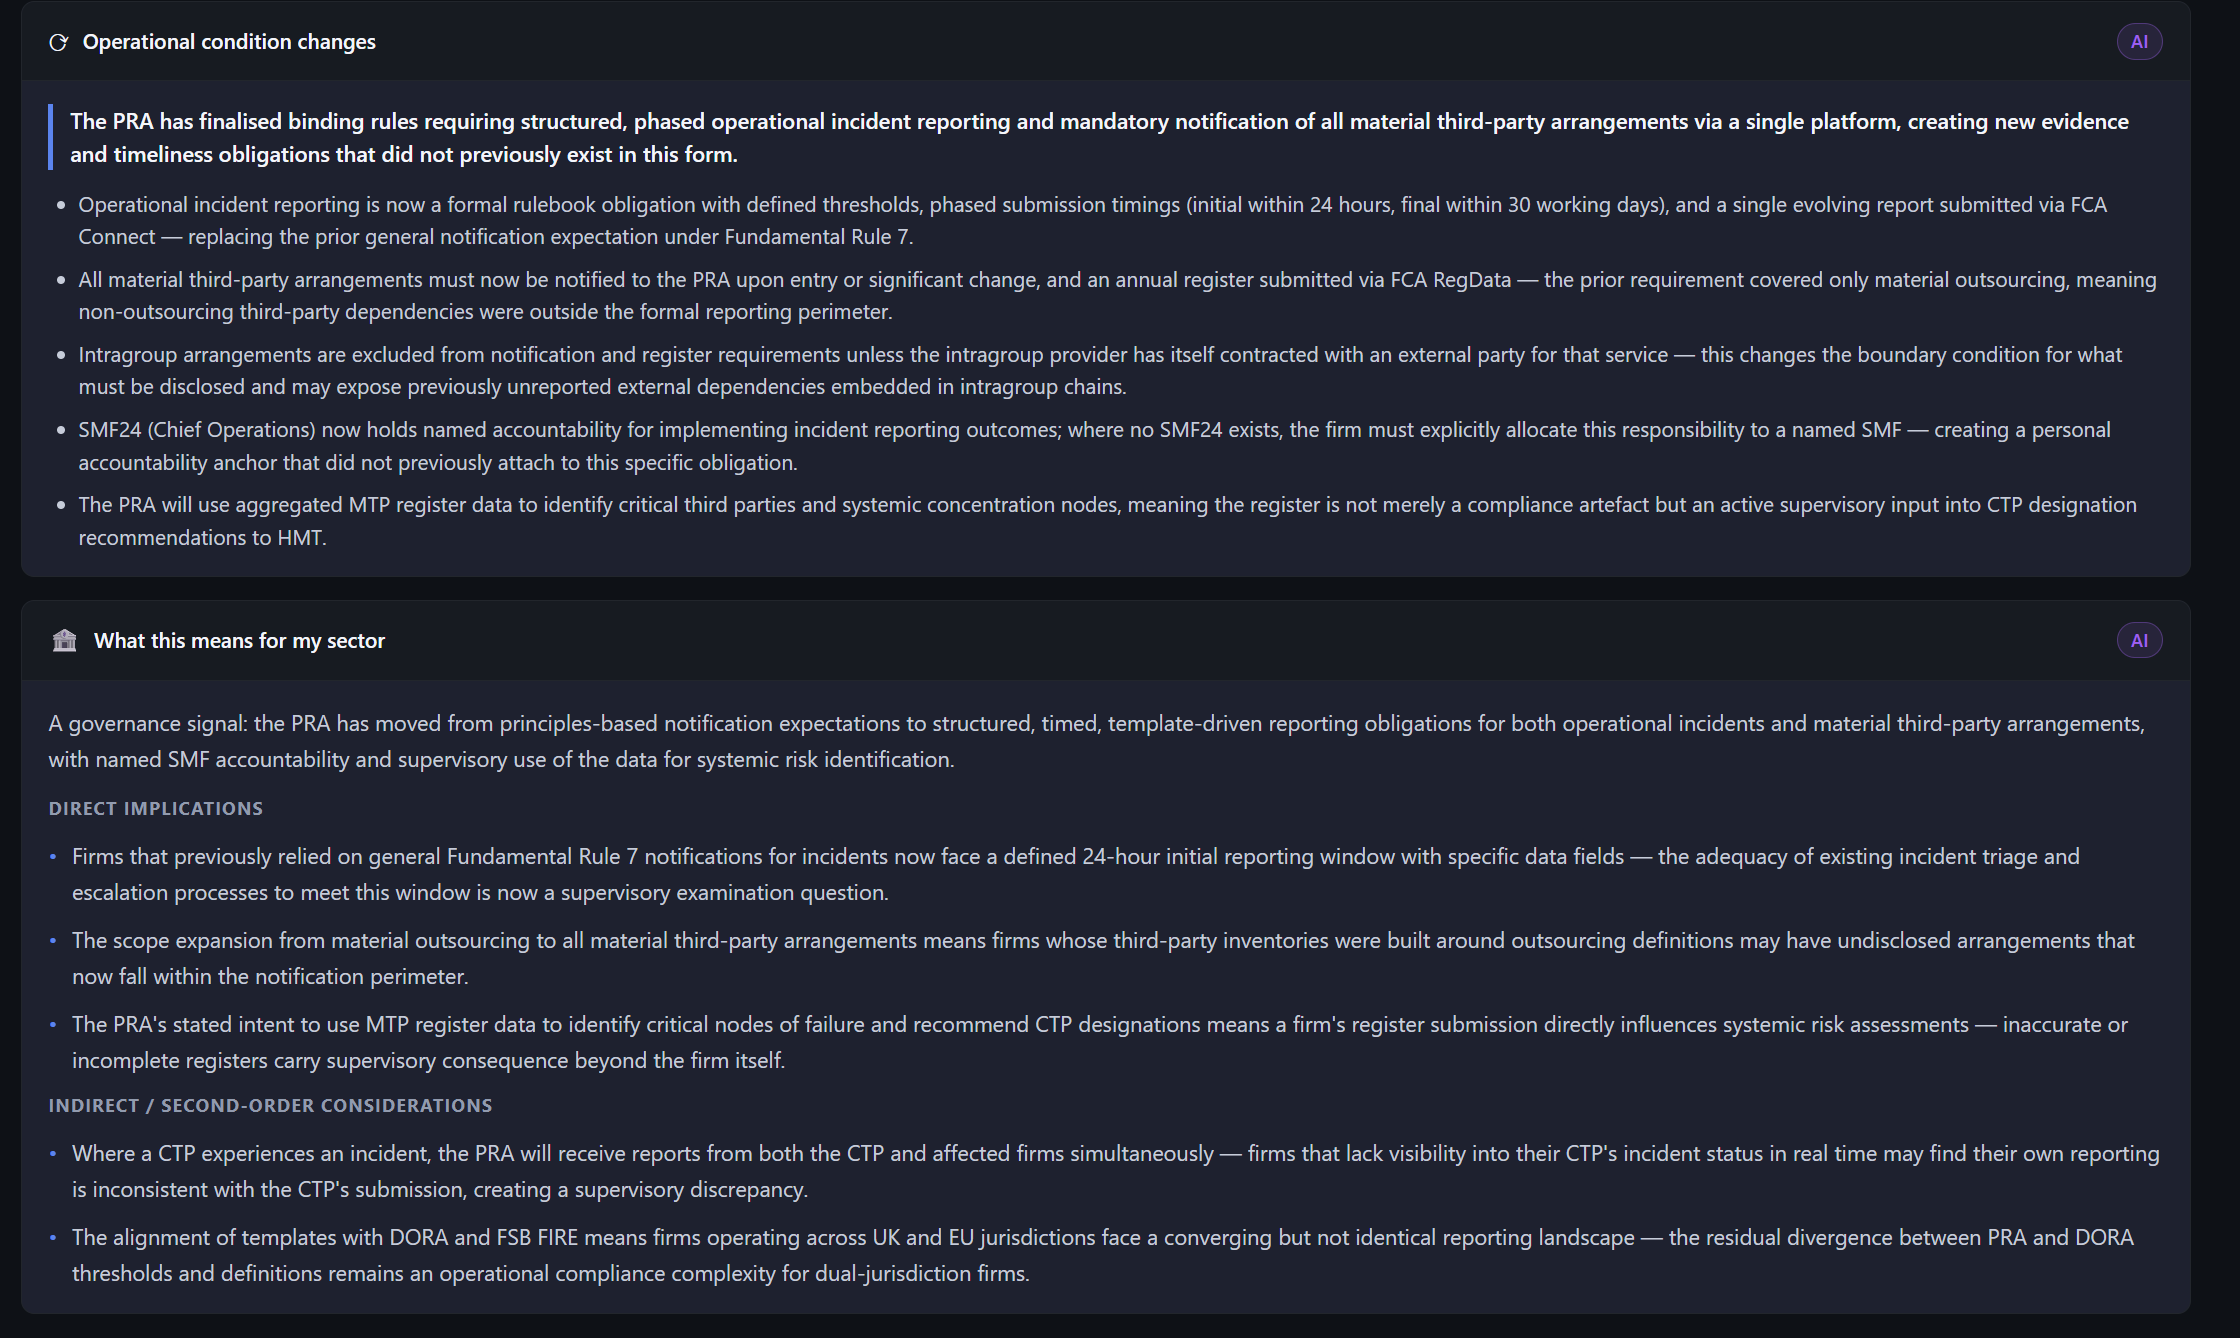
Operational condition analysis showing extracted governance, reporting, and third-party risk implications derived from regulatory publications, including second-order operational and supervisory considerations.
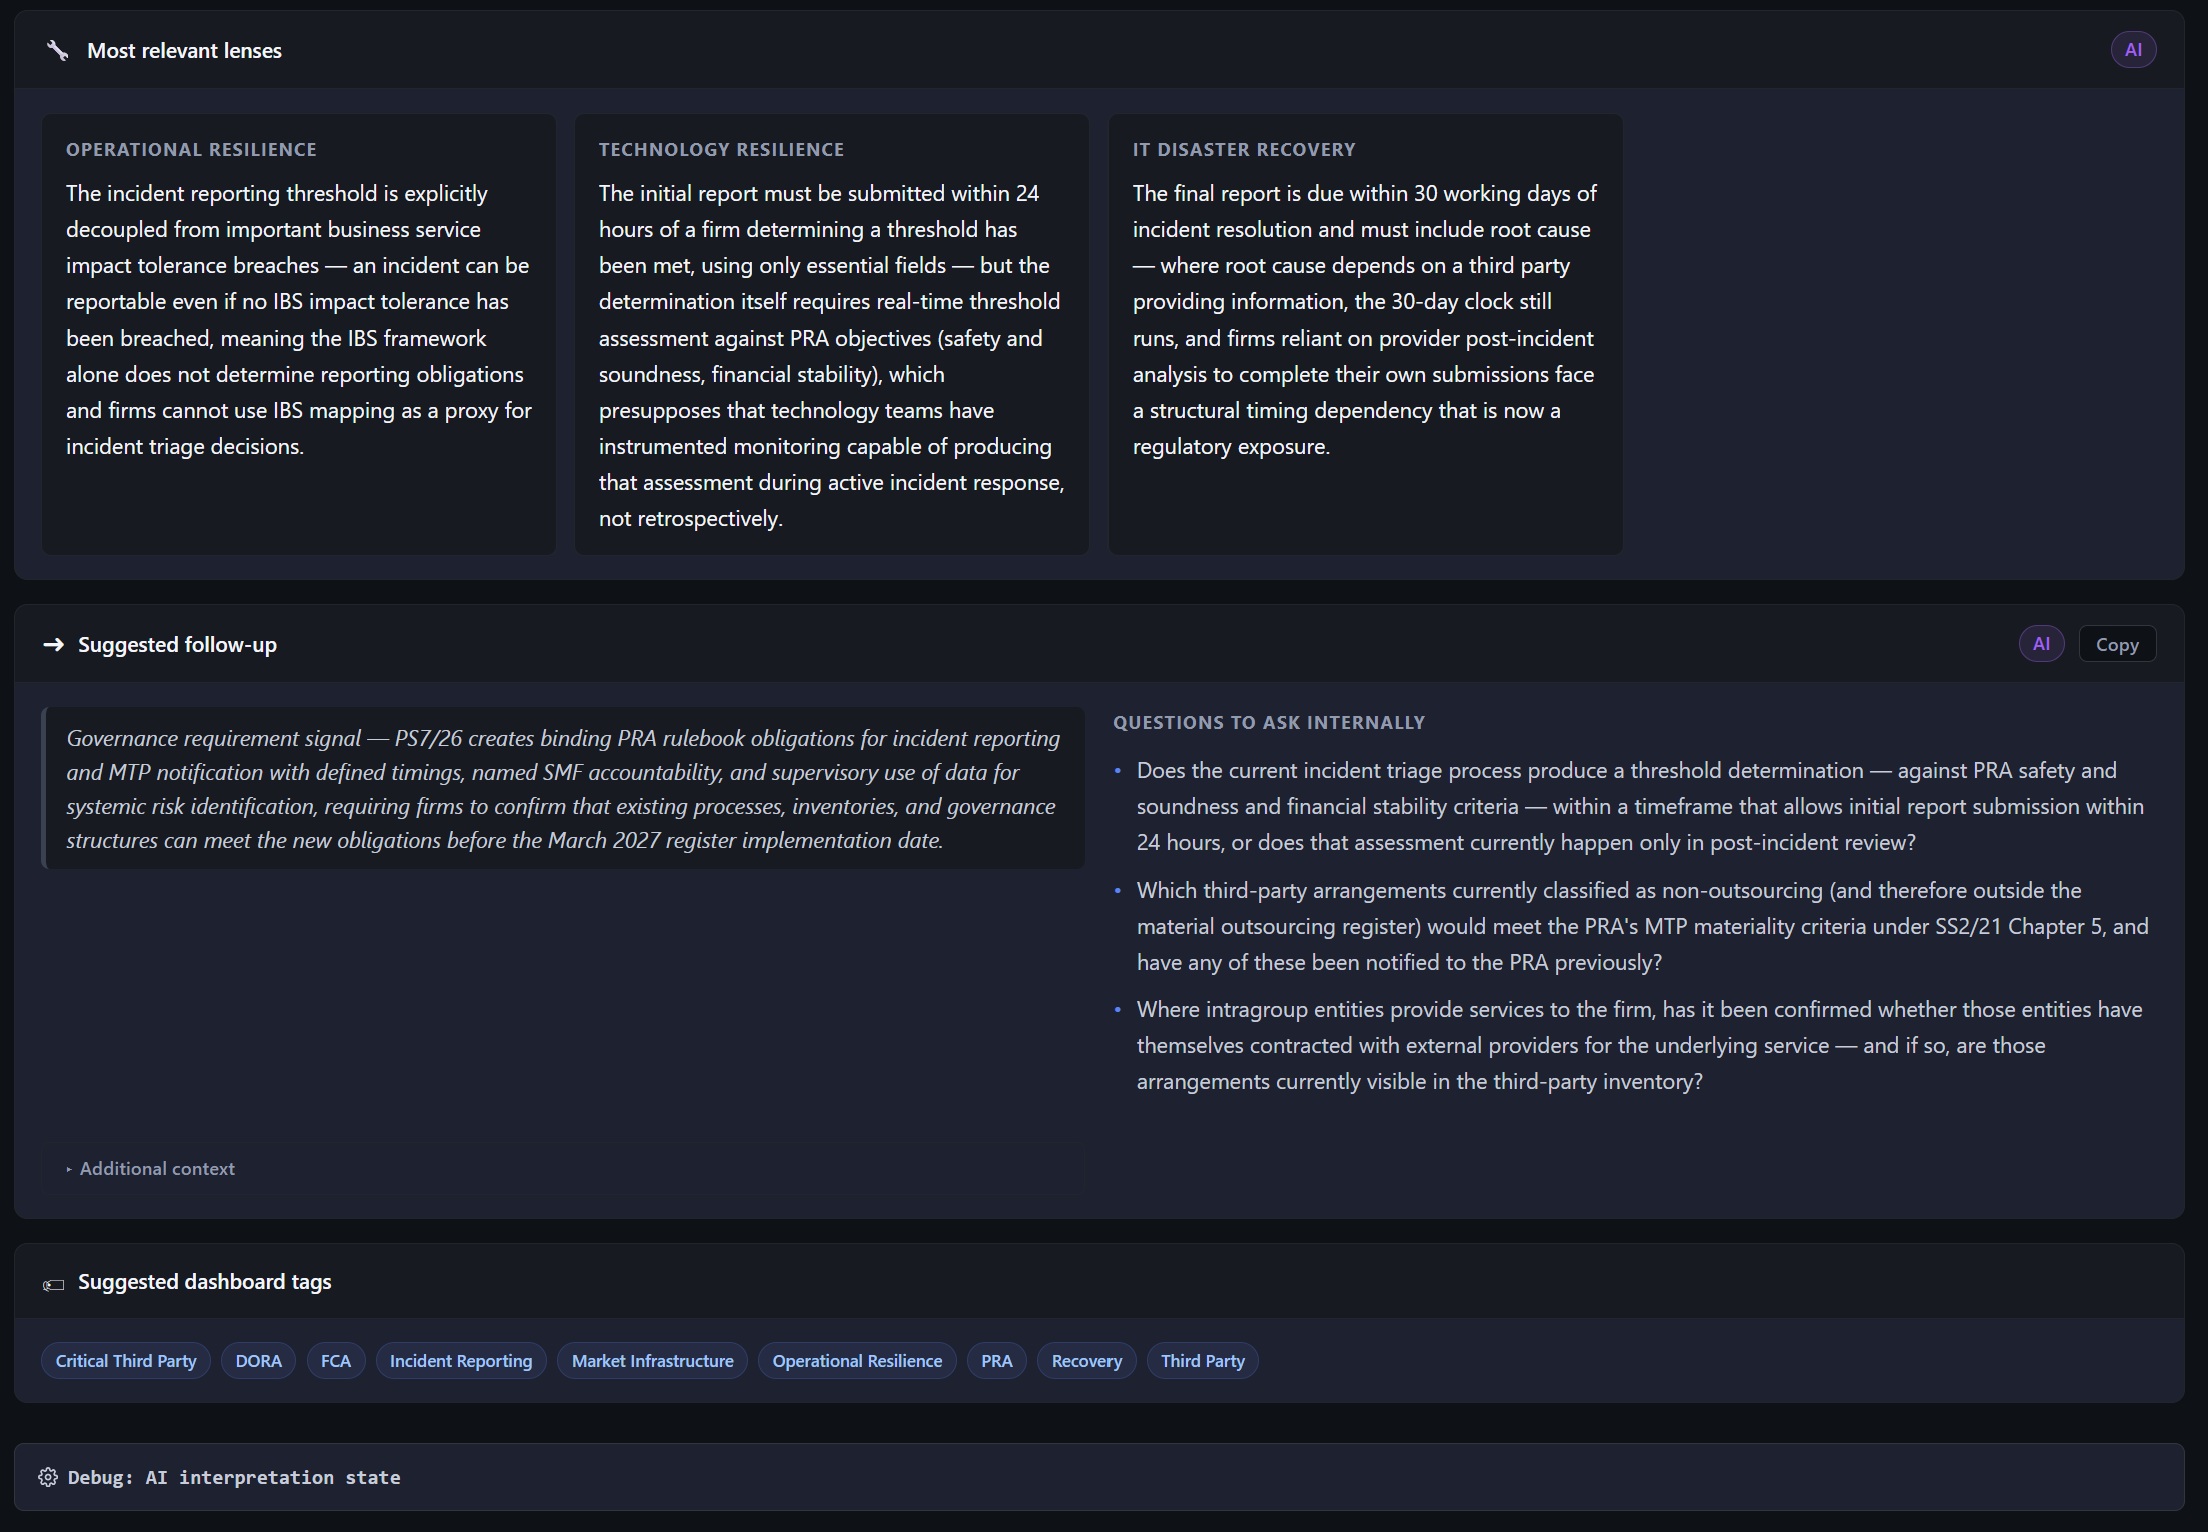
Role- and domain-specific interpretation view showing resilience implications, follow-up considerations, and operational questions generated across operational resilience, technology resilience, and IT disaster recovery perspectives.